Developer Productivity Metrics That Don’t Rely on Keyboard Activity

At 10 a.m., Maya commits a two-line fix for a checkout bug. By 10:15, the tests pass. The fix sits in the review queue until 4 p.m., then ships in the next release. While she waits, Maya helps a teammate debug a flaky test. A keyboard tracker might flag a quiet afternoon. The team’s real problem was right there in the timestamps: a fix for paying customers spent almost six hours waiting for review.
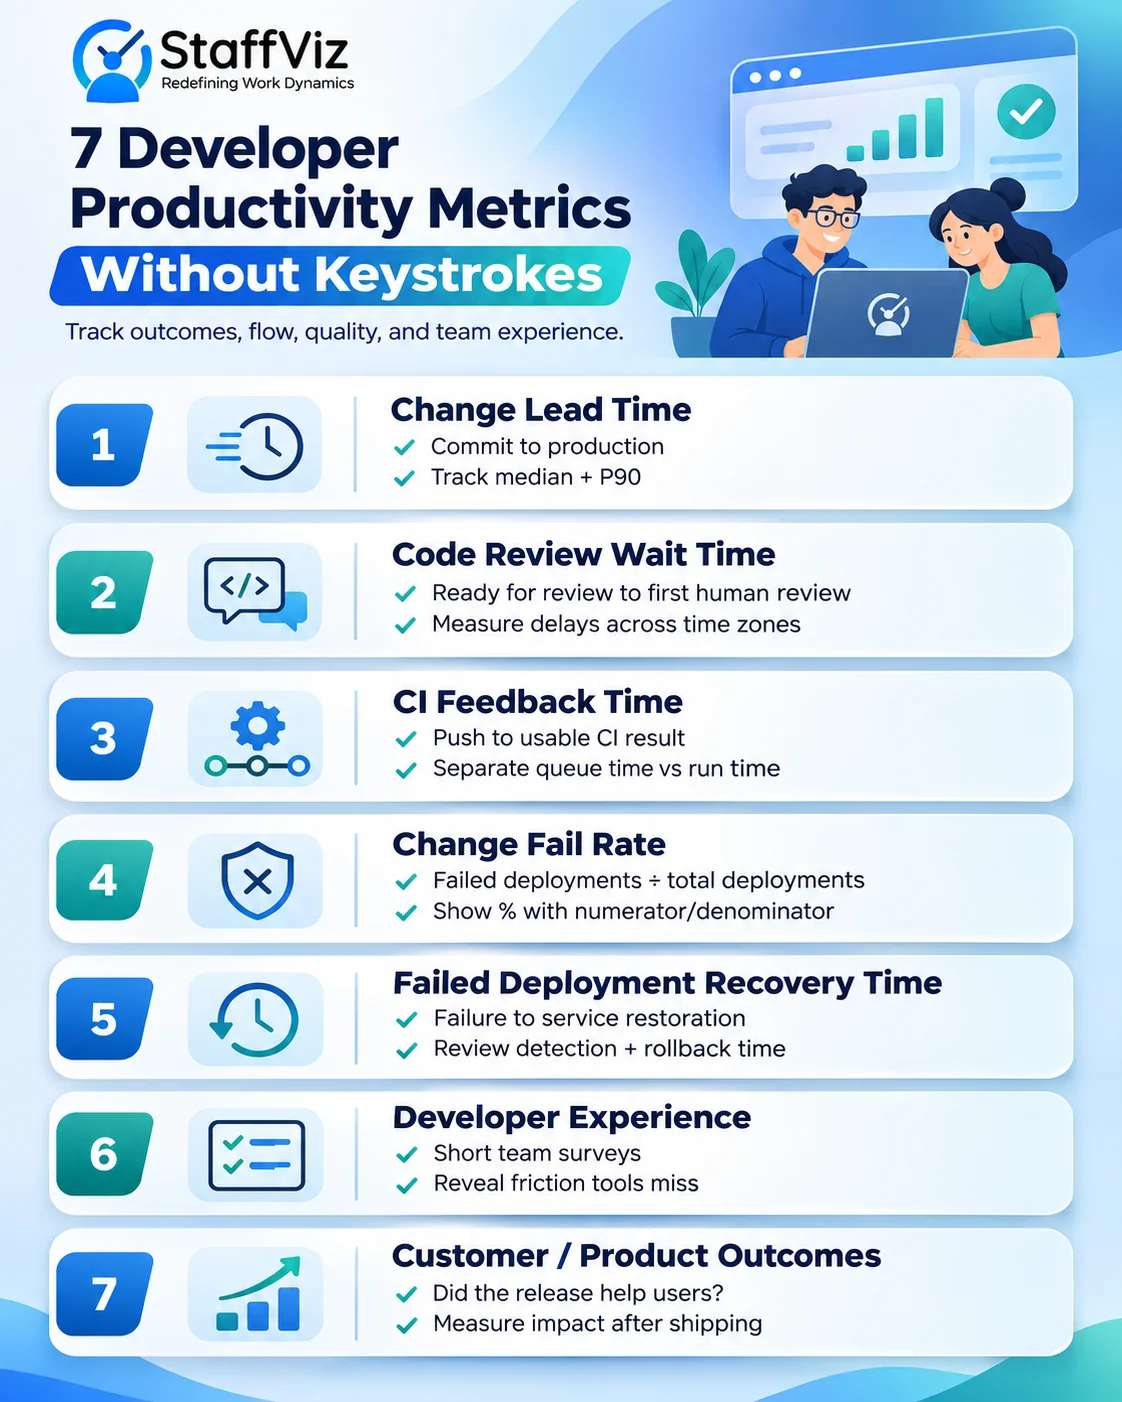
If you manage a software team, you need developer productivity metrics that tell you where work gets stuck, how safely it ships, and whether it improves anything for users. Start with change lead time, code review wait time, CI feedback time, change fail rate, failed deployment recovery time, developer experience, and one customer outcome. Together, they give you concrete questions to bring to your next retrospective.
Why Keyboard Activity is a Poor Measure of Developer Productivity
Typing is one part of building software. A developer might spend an hour walking a teammate through a risky migration, reading a production trace, or deciding to remove code that the team no longer needs. Each can be the most valuable work they do that day. Keystrokes, lines of code, and commit counts capture pieces of activity, but the counts tell you little about the decisions behind them.
The SPACE framework describes five dimensions of developer productivity: satisfaction and well-being, performance, activity, communication and collaboration, and efficiency and flow. Its authors argue against reducing productivity to a single measure. That matters when a senior engineer spends a sprint unblocking others or when the team pauses feature work to prevent a recurring incident. Those contributions show up in different places.
7 Developer Productivity Metrics you can Track Without Keystrokes
Choose measures tied to decisions your team can make. Release data can point you to a slow pipeline. A short developer survey can tell you why that same pipeline feels unreliable. A product metric can show whether shipping the change actually helped customers.
1. Change lead time
Change lead time is the elapsed time from a code commit to its deployment in production. Link version-control timestamps to production deployment records, then report the median and, once you have enough observations, the 90th percentile. The median describes a typical change. The 90th percentile helps you see how long changes near the slow end take.
When lead time rises, break it into stages. Check how long changes wait for review, how long validation takes, and how long merged changes wait for a release. Use consistent commit and deployment attribution, especially if your team squashes commits or ships several changes together. If a release train runs on Tuesdays, a change merged on Wednesday can spend nearly a week waiting even with fast reviews.
2. Code review wait time
Measure from the moment a pull request is ready for review to the first substantive human review. Use the ready-for-review timestamp for draft PRs and exclude bot responses. For a team spread across time zones, decide whether you’ll report elapsed time or working hours. Elapsed time shows the delay a change experiences. Working hours help you examine staffing and handoffs.
If Maya’s team sees the same pattern on several checkout fixes, look at code ownership and reviewer coverage. A reviewer rotation might help if the queue sits unattended. Cross-training might help if one person owns the payment module. Discuss a few real pull requests at the retrospective so the team can test its explanation against the work.
3. CI feedback time
Measure how long developers wait for a usable result from continuous integration (CI). Start the clock at the push or event that triggers the pipeline. Stop it when the required checks return a pass or an actionable failure. Record queue time and execution time separately so you know which delay you can address.
Suppose a suite runs in six minutes, but jobs spend 14 minutes waiting for a runner. Faster tests would improve one part of the experience. Runner capacity or job scheduling would address the larger delay. Track flaky reruns alongside CI feedback time, too. A result loses value when developers routinely have to rerun the pipeline to find out whether a failure is real.

4. Change fail rate
Divide production deployments that require immediate intervention by total production deployments in the same period, then multiply by 100. A rollback or urgent hotfix can qualify, depending on the criteria your team agrees to use. Keep those criteria stable across reporting periods.
Show the numerator and denominator alongside the percentage. One failed deployment out of five reads very differently from 20 out of 100, even though both rates are 20%. Review this metric alongside change lead time. If delivery speeds up and the failure rate rises, inspect what changed in release size, validation, or rollout practices before deciding that the faster process worked.
5. Failed deployment recovery time
Track the elapsed time from a failed production deployment to service restoration. Record when recovery actually happened, even if the incident ticket was closed hours later. Keep the original deployment time and detection time so you can see whether delayed detection contributed to the total.
During incident reviews, compare where the time went. Did someone need to find the right owner? Was rollback slow because it required manual approval? Could responders tell which deployment caused the issue? The answer might point to better alerts, clearer ownership, or a rehearsed rollback procedure. When incidents are rare, review individual cases alongside any aggregate figure.
Change lead time, change fail rate, and failed deployment recovery time are three of the five DORA software delivery metrics. The other two are deployment frequency and deployment rework rate. Use the measures that fit the service and the decision in front of you. For instance, deployment frequency can help you evaluate whether a team has moved from infrequent release batches to smaller, regular releases.
6. Developer experience
A short developer experience survey can explain delays that engineering tools only timestamp. Ask about feedback loops, the effort it takes to navigate tools and systems, and the ability to focus. Those areas reflect the DevEx research framework.
Try asking developers to rate the statement “I can validate a routine change quickly” on a five-point scale. Follow it with an open question about what slowed them down in the past two weeks. If developers mention local environment setup while CI times look healthy, you’ve found friction that the pipeline data never had a chance to capture.
Review responses at team level and share what you’ll change. For a small team where comments could identify people, summarize themes carefully and offer a private way to give feedback. Repeat the same question after the change so you can compare responses over time.
7. Customer or product outcomes
Give each meaningful change a measure of what should improve for the people using it. For the checkout fix, track the share of checkout attempts affected by the specific error Maya fixed. For a search improvement, track how often users get zero results for the affected queries. For a platform team, track whether internal developers can provision a test environment without asking for help.
Choose the event, denominator, and comparison period before rollout. If the checkout error falls afterward, check traffic volume and whether other releases or payment provider changes could have influenced the result. Where practical, compare against a similar group that hasn’t received the change. Delivery metrics tell you when Maya’s fix reached production. The outcome measure tells you whether customers kept running into the bug.
How to Build a Developer Productivity Scorecard
Start with a question your team has already asked. Suppose it’s “Why do small fixes take so long to reach customers?” A first scorecard could include change lead time, review wait time, change fail rate, and a short survey question about where engineers lose time. Add a customer outcome when you have a specific release to evaluate.
Write down each metric’s start event, end event, exclusions, and owner. Use the same service and reporting window when comparing periods. With a small sample, show counts and look at individual changes before drawing conclusions from percentiles. Keep the scorecard at team or service level. A reviewer handling the hardest changes and a developer making routine updates have different opportunities to influence these numbers.
What a 30-day pilot could look like
In week one, pick one service and agree on the definitions. Pull the previous month’s data if it’s reliable, and review five representative changes together. Note release freezes, outages, or missing timestamps that could distort the comparison.
In week two, ask the team where work gets stuck. If the data and the team both point to long review queues, try a rotating reviewer for small fixes and agree on when someone should flag a waiting pull request. Keep the change small enough that you can tell what you tested.
In weeks three and four, compare the same measures. Suppose median review wait drops from 18 hours to seven and change lead time falls from three days to two. If failed deployments move from one in 22 to one in 24, check the underlying cases before declaring a trend. Ask whether the rotation is manageable and whether any review backlog shifted to larger changes. Decide together whether to keep it, adjust it, or try a different fix.
Where StaffViz Fits in an Engineering Workflow
Your Git, CI/CD, incident, and product analytics tools are the sources for delivery and outcome data. If you also need to understand how project time is allocated, StaffViz project and task management lets you organize work by project, review time reports, and distinguish billable from non-billable work. For example, an agency can review how much project time went to support and maintenance before estimating the next sprint. A team that sees more time going to unplanned support can bring that context to a discussion about slipping feature work.
Use project hours to discuss capacity and billing. Use the engineering scorecard to investigate delivery and quality. For more on giving teams autonomy while staying informed, see StaffViz’s guide to avoiding micromanagement.
Start with the Delay your Team Feels Most
Bring one recent fix to your next retrospective and walk through the time between first commit and production. Pick the longest recurring wait, assign an owner, and test one change over the next month. If you also need a clearer view of project hours, task progress, or billable work, visit StaffViz and choose Book a Demo to see how its project reporting would fit your team’s workflow.

Frequently Asked Questions
How do you measure developer productivity without monitoring employees?
Use team-level data your engineering workflow already produces: pull request history, deployment logs, incident records, and product analytics. Pair those data with developer feedback about bottlenecks. Pick measures that help you make a decision, such as where to reduce waiting or which release practice to improve.
Are story points, commits, or lines of code useful productivity metrics?
Story points can help a team plan within its own estimation process. Commit counts and code changes can help you explore patterns, such as a shift toward smaller batches. Their value depends on context. A large commit might be a generated file, and deleting code can make a system easier to maintain.
How many developer productivity metrics should a team track?
Start with three or four that address a specific problem. A team with slow releases might use change lead time, review wait time, change fail rate, and one survey question. Add another measure when it would help you make a decision the current ones leave open.
How can I tell if code review is the real bottleneck?
Measure the time from when a pull request is ready for review to its first substantive review. Compare that with the time spent making revisions and waiting for deployment. If the initial wait is consistently the longest stage, look at reviewer availability and who can approve changes in that part of the codebase.
How do you measure the impact of refactoring or technical debt work?
Pick the problem the work is meant to solve and measure it before and after. If the team refactors a flaky test suite, compare how often developers rerun it and how long they wait for a reliable result. If the team simplifies a fragile deployment process, compare how often releases need manual intervention.
How often should engineering teams review developer productivity metrics?
Review delivery trends at each sprint retrospective so the team can connect the numbers to specific changes in its workflow. For teams that deploy infrequently, review release quality over a longer period and show the underlying counts alongside percentages. One failed deployment can swing the rate when the team ships only a few times a month.
Can you compare developer productivity metrics across teams?
Use each team’s historical baseline to judge improvement. A team releasing a customer-facing app and a team maintaining a shared platform may have different approval requirements, dependencies, and release schedules. If you compare teams, align metric definitions and use the differences to ask where each team needs support.
How can engineering teams use StaffViz alongside DORA metrics?
Use StaffViz project time reports to see where engineering hours went, then use Git and deployment records to measure delivery speed and stability. If change lead time rises during a month when more hours went to support work, bring both data points to the retrospective and check where changes actually waited.
Can developers record project work in StaffViz without using keyboard activity as a productivity metric?
Yes. StaffViz supports manual time entry for work such as architecture discussions, debugging sessions, and mentoring. Use those entries to understand how time was allocated, then assess the work through the relevant outcome, such as a resolved incident or a teammate getting unblocked.
How can software agencies use StaffViz to improve project estimates?
StaffViz lets agencies categorize hours as billable or non-billable and review time by project. After delivery, compare recorded hours with the original estimate. If recurring support or maintenance took more time than planned, use that history to budget for similar work in the next engagement.
Effectively Manage Remote and Hybrid Teams with StaffViz
Enhance team efficiency and collaboration with StaffViz, the ultimate tool for managing remote and hybrid teams.
Talk To Us

Table of Content
- Why Keyboard Activity is a Poor Measure of Developer Productivity
- 7 Developer Productivity Metrics you can Track Without Keystrokes
- How to Build a Developer Productivity Scorecard
- What a 30-day pilot could look like
- Where StaffViz Fits in an Engineering Workflow
- Start with the Delay your Team Feels Most
- Frequently Asked Questions